Developer Experience, Feedback Loops, and an Enjoyable Workflow for Node.js Tool Development
There’s been a lot of focus on the topic of DX or developer experience recently, which is great because it’s something that I’m passionate about improving on the teams I work with. So passionate, in fact, that I recently transitioned out of a customer-focused engineering role into one focused on developers, tooling, and infrastructure.
Now you might be asking yourself, ‘What does DX actually mean?’, and you would be justified in asking – I’ve heard varied interpretations of the term.
Jean Yang defines it this way in The Case for Developer Experience:
What I mean by developer experience is the sum total of how developers interface with their tools, end-to-end, day-in and day-out.
I think that a big part of the “how” there is the concept of feedback loops. Good developer tools provide affordances that reduce cognitive load, surface key information at the right time, but most importantly, good tools prioritize keeping feedback loops fast – and nothing depletes my cognitive batteries faster than slow, clunky tools.
Building Tools with Node.js
I first started working with Node around version 0.4 in 2011 and at the time I had absolutely no idea how anything worked. I came from a designer-first frontend background and my knowledge of JavaScript was limited to the context of the browser.
Jumping into Node was extremely disorienting for me, up was down and left was right, window was global and there was no XHR or DOM. Writing modules, packages, and command-line tools was all new to me, yet I was intrigued by the potential to leverage my knowledge of JavaScript within the world of tool building and systems programming.
Around this time I was working with Searls, who created Lineman after I shared frustrations with most of the frontend tooling I was using.
This experience was transformative for me because up until that point the tools I was using were clunky, written in other languages I didn’t know as well, and incredibly slow. Justin’s focus on the DX of Lineman was immediately apparent and the fact that it was written in JavaScript (ok, and a lot of CoffeeScript) made it easy for me to contribute to. It was empowering to have someone listen to my frustrations and translate them into magic on the command-line!
Since then, I’ve been able to work on some of my own tools, libraries, and plugins while picking up a few tips, tricks, and many opinions along the way. My hope is that sharing my experience will give you the starting place I wished for when learning to build tools in Node and lead you to a more enjoyable developer experience.
Ok, but how do I start?
Great question! It’s the same one I had when I was interested in writing command-line tools with Node. The rest of this post will be a guided tutorial that I think will help you get started and answer the following questions:
- How can I iterate on a node module locally without publishing to npm?
- How can I test what I’m building in another project?
- How can I debug the code while developing?
- How should I package things?
Prerequisites
You’ll need the following in order to follow along:
- an installation of
node >= v16andnpm >= v8 - a terminal app like
terminal.apporpowershell - your favorite code editor
optionala checkout of the full example repo
If you prefer to follow along step-by-step, let’s get started by running the following commands to create a workspace folder for the tutorial.
I like to use ~/code/node, but you can use whatever you are most comfortable with.
$ # create tutorial directory
$ mkdir -p ~/code/node
$ cd ~/code/node

$ # create the my_project directory and initialize it with npm
$ mkdir my_project
$ cd my_project
$ npm init -y
$ cd ..

$ # create the my_tool directory and clone the workflow template
$ mkdir my_tool
$ cd my_tool
$ npx degit davemo/nodejs-tool-dev-template
$ npm i
Using the tree command, we can visualize the folder structure.
$ tree -L 2 ~/code/node

~/code/node
├── my_project
│   └── package.json
└── my_tool
    ├── dist
    ├── index.js          # executable entrypoint file
    ├── lib
    │   └── tool.js       # module that logs to STDOUT
    ├── node_modules
    ├── package-lock.json
    ├── package.json
    └── test

6 directories, 4 files
The my_tool directory comes with an entrypoint file index.js which will be our CLI tool. This entrypoint requires and executes lib/tools.js which logs a simple message to STDOUT and completes after a delay of 1 second.
// my_tool/index.js
#!/usr/bin/env node

require('./lib/tool.js')();
// my_tool/lib/tool.js
module.exports = function tool() {
  console.log('⏳ CLI tool: working ...')
  setTimeout(function() {
    console.log('✅ CLI tool: done!')
  }, 1000);
}
Iterating locally using npm install <dir>
Often you will want to test a node module in another project locally without having to publish it. There are a few ways to do this but we want to optimize for the best developer experience in our workflow, so I’m going to focus on using npm install <dir>.
Install my_tool from within my_project
$ cd my_project
$ npm install ../my_tool

added 1 package, and audited 3 packages in 634ms
Installing a package this way causes three side-effects that we should know about.
$ # a symbolic link for my_tool is created in node_modules
$ ls -la my_project/node_modules
my_tool -> ../../my_tool

$ # a symbolic link for the executable is created in node_modules/.bin
$ ls -la my_project/node_modules/.bin
my_tool -> ../my_tool/dist/index.js

$ # my_tool is added to dependencies mapped to a relative file path
$ cat package.json | grep -A2 dependencies
"dependencies": {
  "my_tool": "file:../my_tool"
}
The addition of the relative
file:path independenciesis nice because it serves as a physical reminder that we are in development mode; something we don’t get usingnpm link.
Now that we’ve got things installed, we’re ready to start iterating on my_tool and testing how it works inside of my_project.
Testing our tool in another project
To work with my_tool inside of my_project we’re going to use npm scripts inside my_project/package.json. Let’s add a script log_a_message that invokes my_tool.
// my_project/package.json
{
  "name": "my_project",
  "version": "1.0.0",
  "description": "",
  "main": "index.js",
  "scripts": {
    "log_a_message": "my_tool" // add this script
  },
  "keywords": [],
  "author": "",
  "license": "ISC"
}
We can now execute npm run log_a_message to invoke my_tool.
$ npm run log_a_message

> my_project@1.0.0 log_a_message
> my_tool

⏳ CLI tool: working ...
✅ CLI tool: done!
What happens when we call npm run log_a_message?
To better understand what’s going on, let’s take a look at the name and bin keys within the scaffolded package.json that came with the workflow template.
// my_tool/package.json
{
  "name": "my_tool",

  // explicit mapping syntax
  "bin": {
    "my_tool": "dist/index.js" // bin.my_tool invokes dist/index.js
  },

  // implicit mapping syntax
  "bin": "dist/index.js" // package.name invokes dist/index.js
}
In our case, because the name of the package and the command are the same, we could simplify using the
implicitsyntax, but I generally prefer to use theexplicitsyntax just to make it clear to future readers.
The bin key in my_tool/package.json is a mapping of the command name (my_tool) to the local file name (dist/index.js) that will be executed.
With that in mind, this is roughly what happens when we run npm run log_a_message:
- npm looks for
scripts.log_a_messageinmy_project/package.json - npm appends
my_project/node_modules/.binto the shell’s pre-existingPATH - npm resolves
my_tooltomy_project/node_modules/.bin/my_toolwhich is a symlink tomy_tool/dist/index.jsbecause of thebinmapping. my_tool/dist/index.jscontains a unix shebang#!/usr/bin/env node- the script is effectively executed with
node my_tool/dist/index.js
Development workflow: (watch, build) + (debug)
With my_toolinstalled within my_project, the next thing we might want to do is debug our tooling code as we iterate while developing. There are a few included npm scripts in the workflow template that we’ll find within my_tool/package.json.
"scripts": {
  // watch: runs the build, compiling on every change
  "watch": "npm run build -- -w",

  // build: a one time compile using @vercel/ncc
  "build": "ncc build index.js -o dist --source-map",

  // debug: open ndb to debug our compiled tool
  "debug": "ndb dist/index.js"
}
Watch + Build with @vercel/ncc
The watch target here invokes build and passes along the -w parameter which tells ncc that it should watch for file changes and recompile every time a change is detected.
The build target invokes ncc, which traverses the dependency graph starting at our index.js entrypoint, and compiles everything it finds (including dynamically imported things) into a single file with all dependencies inlined, kind of like gcc.
To kick things off, run npm run watch from within my_tool.
$ cd my_tool
$ npm run watch

> my_tool@1.0.0 watch
> npm run build -- -w

> my_tool@1.0.0 build
> ncc build index.js -o dist --source-map "-w"

ncc: Version 0.31.1
ncc: Compiling file index.js into CJS
File change, rebuilding...
 2kB  dist/index.js
 2kB  dist/index.js.map
40kB  dist/sourcemap-register.js
42kB  [113ms] - ncc 0.31.1
Watching for changes...
I like starting with this “watch-build” workflow when developing for a few reasons:
✅ It compiles on every file change and compilation is effectively the first unit test; this gains us confidence that we aren’t introducing simple bugs as we develop.
📦 It sets us up to be ready to publish our module to npm as soon as we are done developing; the
distfolder is the only thing we need to upload to npm.⏭
nccgenerates sourcemaps, so we get the same DX benefits of debugging againstmy_tool/index.jsin concert with the compilation benefits above.
Debugging with ndb
The debug target spins up ndb pointing at our single compiled file in dist/index.js. The feedback loop when developing and debugging is nearly instant, and ndb includes some really nice DX features which we’ll look at shortly.
First, let’s add a debugger statement within my_tool/lib/tool.js knowing that it will be compiled into dist/index.js automatically by our Watch + Build process.
// my_tool/lib/tool.js
module.exports = function tool() {
  console.log('⏳ CLI tool: working ...')
  debugger; // add a debugger statement here
  console.log('another one');
  setTimeout(function() {
    console.log('✅ CLI tool: done!')
  }, 1000);
}
Then, in another terminal window let’s spin up ndb using npm run debug.
$ npm run debug

> my_tool@1.0.0 debug
> ndb dist/index.js

Downloading Chromium r624492...
Chromium downloaded to /Users/davidmosher/code/node/my_tool/node_modules/carlo/lib/.local-data/mac-624492
⏳ CLI tool: working ...
The first time you run the
debugtargetndbwill download Chromium.
With this process launched you should see a Chromium window pop up.
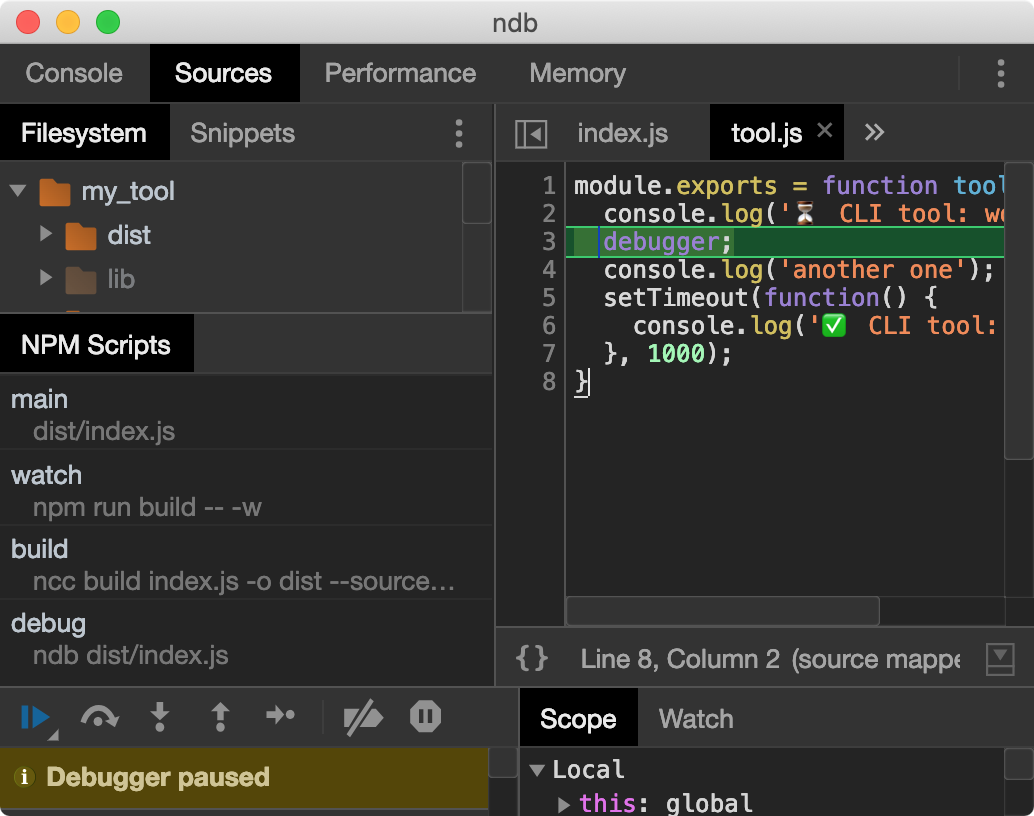
This is where we can see some of the ndb DX specifics I mentioned earlier that make this workflow so nice:
📃 Notice the
NPM Scriptstab? This allows you to repeatedly invoke any npm script right from the GUI. This is really handy for making changes and then testing them immediately.🔁
ndbstays launched and available for you to re-run any of those npm scripts; this is much nicer thannode --inspect-brkwhich exits after the current debug stack is completed.⏭ We can see those sourcemaps I mentioned before at work here,
lib/tool.jsshows up in the source pane even though we’re debuggingdist/index.js.🐛 Finally, all of your other Chrome DevTools muscle memory applies just the same here as it does when debugging client-side JavaScript! The step-debugger, sources panel, and snippets can all come in handy working here in a node-based JS context.
Packaging with @vercel/ncc and npm
When you’ve finished creating your command-line masterpiece the next thing you may want to do is publish it to the npm registry so that others can npm install it. Thankfully, this step is easy because we already configured ncc to build for production in the dist folder via our build npm script.
The last thing to consider is how to minimize the size of our package when a user installs it with npm install, and this has already been done for us in the files key within my_tool/package.json key.
{
  "name": "my_tool",
  "version": "1.0.0",
  "description": "a template for developing node.js command-line tools",
  "main": "index.js",
  "bin": {
    "my_tool": "dist/index.js"
  },
  "files": [ // manages which files are published to npm
    "dist"
  ],
  // ...
}
NPM has some documentation on
filesthat you may find helpful.
Limiting files to just the dist directory ensures that we keep our package as small as possible, which is already taken care of thanks to ncc producing a single file. If you want to double check to see exactly which files npm would add to the package, you can run npx npm-packlist.
$ npx npm-packlist

index.js
package.json
dist/index.js
dist/index.js.map
dist/sourcemap-register.js
Our last step before publishing will be to remove the private: true flag from package.json, which I added so nobody accidentally published the workflow template. Once that’s done, then you can simply npm publish and your minimal package will be uploaded to the npm registry.
Wrapping up
This concludes my tutorial on an enjoyable workflow for Node.js tool development. I hope you found this useful and that you find the experience of developing tools in this way enjoyable and the feedback loop fast and efficient.
If you have questions or wish to provide feedback, please reach out to me on twitter. I would love to hear from you!
Happy tool-making. 💚